Illegal Waste Risk Map (beta)
This map is the interim output from a proof-of-concept project that is released now for consultation and feedback from authorities involved in waste crime prevention. The map is considered under development and is released for review by authorities involved in waste crime so that the methodology used may be improved if necessary. Feedback from enforcement authorities on the map content and any possible refinement to the risk factors is welcomed to analyticsstaff@epa.ie
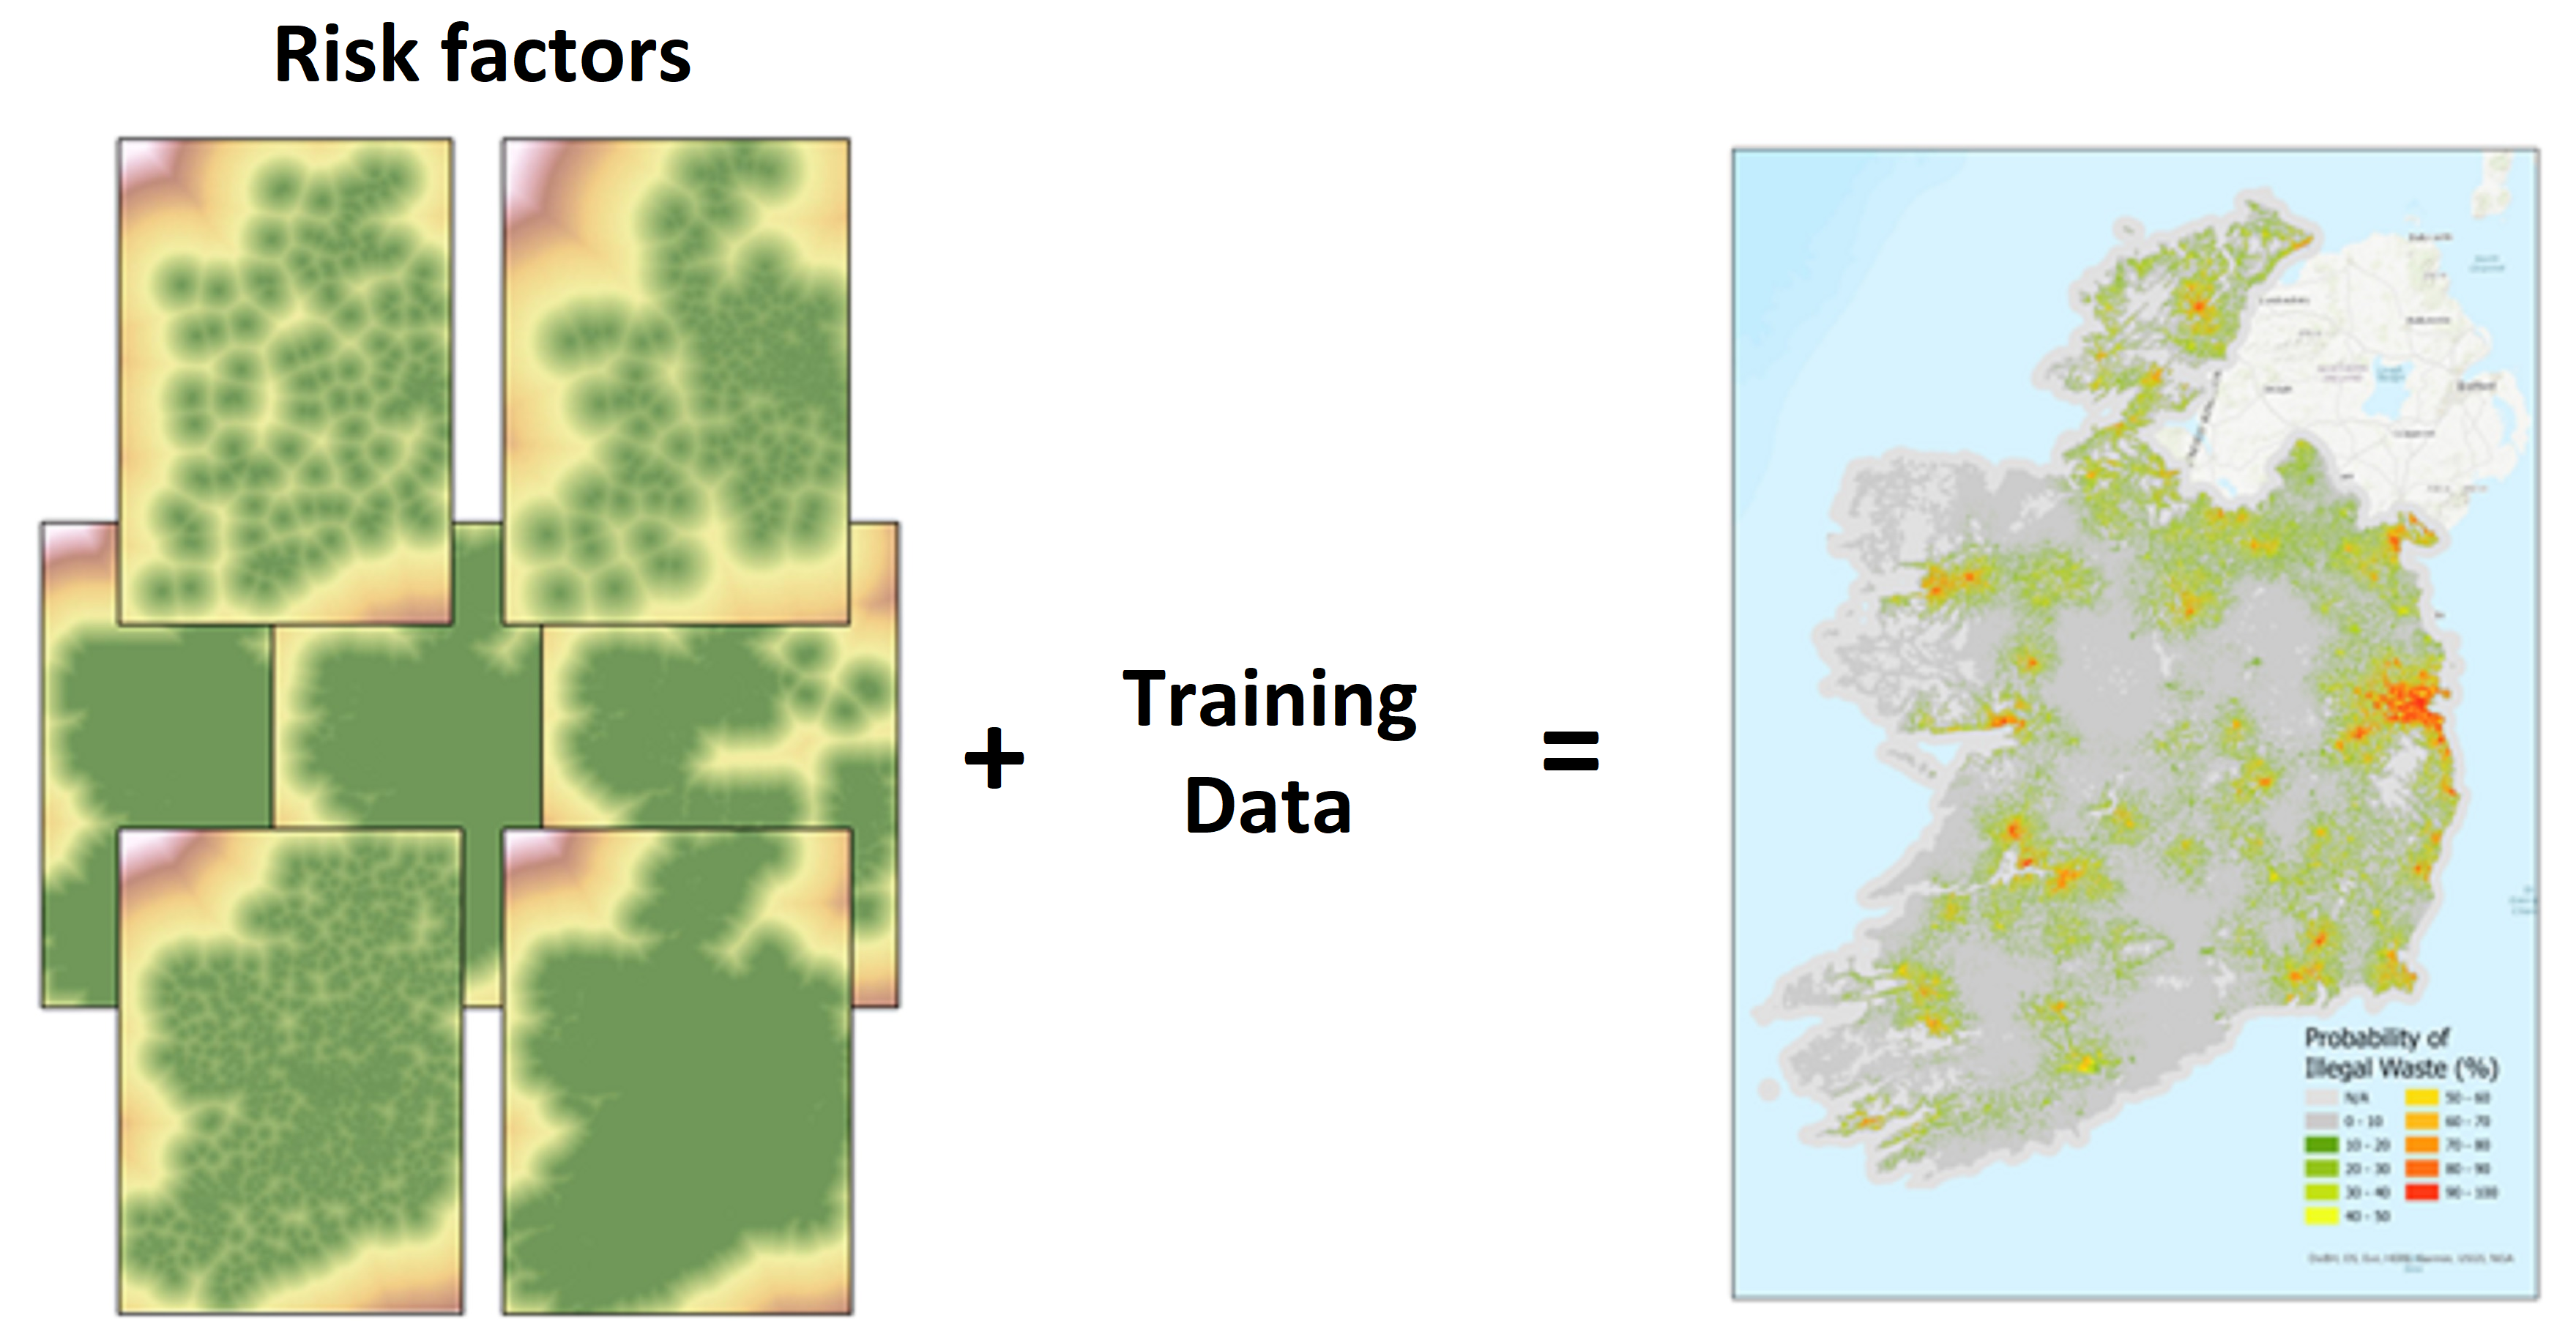
The map shows the percentage probability of illegal waste activity (illegal dumping) occurring in an area based on seven risk factors (shown below). It is intended for use by waste enforcement authorities in proactive waste prevention activities. Areas coloured in green or yellow are least likely (50%) to have illegal waste activities, whereas those showing in deeper orange and especially into red are predicted to be more likely to see illegal waste activities. This is a predictive map that shows probability of illegal waste: this does not mean that the areas of low risk have no risk.
The probabilities shown in this map are derived through a logistic regression model using seven risk factors and a training dataset of potential illegal waste locations.
Following a literature review of 44 international studies, 12 risk factors were identified as relevant in an Irish context. Using the training dataset the relationship between these risk factors and potential illegal waste activities was determined. Through this analysis, seven of the risk factors proved to be statistically significant, namely;
- • Distance to quarries • Distance to wetland
- • Distance to construction and demolition sites • Distance to transportation networks
- • Distance to industrial areas • Distance to water
- • Distance to artificial surfaces
A national map for each of these risk factors then formed the independent variables for a logistic regression model. Many combinations of the risk factors were assessed to determine the most accurate output. Ultimately the best output was achieved using all 7 risk factors.
Accessing the map
You can view the map on EPAMaps here where it is visible only between the scales of 1:500,000 – 1:30,000.
You may find it more beneficial to view it alongside your own data on your internal mapping systems. To do this;
Using the map and providing feedback
Please use the map as you see fit to see if or how it can benefit your day-to-day work in waste enforcement. Be sure to zoom in as the map offers more detail than is visible at a national scale.
We consider this map, and the analysis methods that created it, to be a work in progress and are releasing these for the review of waste enforcement authorities. We would greatly value any feedback you have to offer, especially, but not limited to:
- • how useful the map is for you,
- • how accurate you’ve found the predictions,
- • the appropriateness of the risk factors used (should any be removed, or new ones added?)
- • how you are likely to use this map in your day to day work
Also, if you have any training data that you are willing to provide we will gladly incorporate this into the model.
All feedback is gladly accepted to analyticsstaff@epa.ie