Learn More
- What is EPA MAPS?
- Technical Details
- Data sources
- Credits
- Basic Map Controls
- Viewing data in the map
- Accessing Data about Map Features
- Using the Search Tools
- Search for a Townland
- Using the Data Download Section
- Changing Transparency of map layers
- 'How-to' Help Videos
- Using the About Section
- Where to go with queries
What is EPA MAPS?
EPA MAPS is intended to assist anyone with an interest in environmental data to access geographical data produced by the EPA. Much of the data you can view and query on EPA MAPS is also available to download either directly from EPA MAPS or from the Data Download option of theEPA GeoPortal.
Back to TopTechnical Details
Envision was developed using mainly JavaScript and HTML, however, some of the server components are .NET WCF. We have used
- ESRI JavaScript API,
- JQuery,
- Dojo,
- OpenLayers
JavaScript Libraries on the client side; and following products on the server side
- RESTFul web services with WCF
- ESRI ArcGIS Server,
- MS SQL Server 2008 and Reporting Services,
- GeoServer as WFS (OGC Web Feature Service) Server for Downloads,
- GeoNetwork as CS/W (OGC Cataloue Service For the Web) Metadata Catalogue Server for ISO 19115 and INSPIRE Metadata.
We have tested the Envision and believe that it is fully compatible with the following browsers:
- Internet Explorer 8+,
- Firefox 3.5+,
- Chrome,
- Opera,
- Safari 3+.
Envision can be used with older versions of Internet Explorer (IE 7 and IE 8) but there are some small limitations in the display when these versions are used.
Back to TopData Sources
The EPA ENVision mapping viewer has been provided to enable visitors visualise environmental
data and is intended as a tool for the personal investigation of environmental issues.
Data portrayed on the viewer has been provided by a number of sources
- Environmental Protection Agency
- Geological Survey of Ireland
- Teagasc
- National Parks and Wildlife Service
The EPA does not guarantee the accuracy of data presented on this viewer and is
not responsible for incorrect interpretation. If accuracy is important, it is recommended
that you obtain a copy of the original maps on which the information is based and
verify its accuracy.
National Soils Database
The soils classification data associated with spatial points on the map cannot be
used at a local scale, as this information is derived form a scale of 1:575,000
generalised soil map of Ireland and therefore should be used with caution when describing
point or small scale data.
When using the NSDB datasets & maps you are required to cite the original source
of these resources. This citation must include the names of the original authors
of the project or resources. To see a proposed citation from the EPA ERC Safer website
click here
Credits
The MAP icons were reused from the following sources, via the www.icongal.com website: DryIcons, Devcore, LiamMcKay, Artua.com, DesignContest, Visual Pharm, Kyo Tux, Jonas Rask Design. Usage of the icons donated by the designers listed above does not imply that they endorse this website or take any liability for errors or omissions on same.
Back to TopBasic Map Controls
| Map Tools | |
|---|---|
       
|
Zoom in-Zoom out - The map zoom tools can be used to zoom in and out on the map. Zoom In - Use this tool to zoom in on the map: click on this icon, then click and hold down the cursor on the map. Drag the mouse cursor over the area of interest. Zoom Out - Use this tool to zoom out: click on this icon, then click and hold down the cursor on the map. Drag the mouse cursor over the area of interest. Full Extent - Click this tool to zoom out to the full extent of Ireland. Pan - Use this tool to move around the map: click on this icon and then click in map and drag the map in the direction you wish it to move. Identify - Use this tool to find more information about features on a map: click and hold down the cursor on the map and drag over the features of interest. The information will display unter the Results section. Clear - Select this tool once to clear the Results section or any highlighted featuers on the map. Help - Use this tool to find out more about the functionality of the MAP. |
| Other Tools | |
|---|---|
|
Scale Bar - This scale bar map feature dynamically updates to give you the current scale of the map in kilometres (or metres at large scale) Coordinates - This co-ordinates map feature dynamically updates to show you the Irish National Grid co-ordinates of the location of your cursor in the map window. |
Viewing data in the map

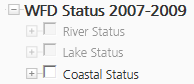
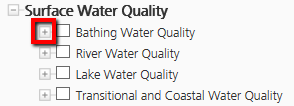
In the Table Of Contents data has been grouped by topic. To expand a topic click
on the “+” beside that topic name. A list of the layers under this topic will appear.
Click on the “-” if you would like to collapse the list down again. To turn
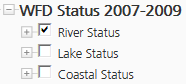
on a layer in the map, click in the checkbox beside the layer name.

If the layer name appears grey and you cannot check the box due to the following cursor image,  ,
it is because the data in this layer is so detailed it can only be visible only at large scales. Zoom in on
the map and once the layer name becomes dark instead of light grey you will be able to
make it visible.
,
it is because the data in this layer is so detailed it can only be visible only at large scales. Zoom in on
the map and once the layer name becomes dark instead of light grey you will be able to
make it visible.
|
|
|
To turn a data layer off, simply click in the checkbox beside the
layer name to uncheck it.
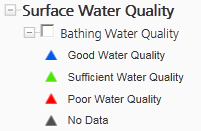
To see the legend for a map layer click the “+” beside the layer name, this expands a list of all the symbols used in that layer and what they mean. Click on the “-” beside the layer name if you would like to collapse this symbols list down again.
|
|
|
Accessing Data about Map Features
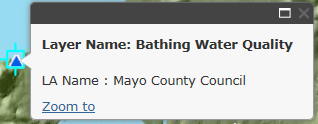
Data about a single feature on the map can be accessed by simply
clicking on the feature.
Use
the information button to access data about a number of features
on the map. Click on the information tool and then click in the map
and draw a box around the area of interest. Results will appear in the Results window
for all the visible features in this area. Please note that the number of results in a single information query has been automatically
limited to 100, to ensure that the browser
will not crash. Use the arrow
 to expand the information for a result.

Use the zoom button
 to zoom to that feature in the map. Extended data reports have been created for
some layers, and can be accessed via the Report button
to zoom to that feature in the map. Extended data reports have been created for
some layers, and can be accessed via the Report button
 . This button will only appear if an extended report is available. The forward and
back buttons at the bottom of the results list can be used to scroll through all
the results for the features you have selected.
. This button will only appear if an extended report is available. The forward and
back buttons at the bottom of the results list can be used to scroll through all
the results for the features you have selected.

Use the clear tool to clear the results window. The same tool can be used to clear
the selection you make on a single line or polygon in the map window and return
to a normal data view.
Using the Search Tools
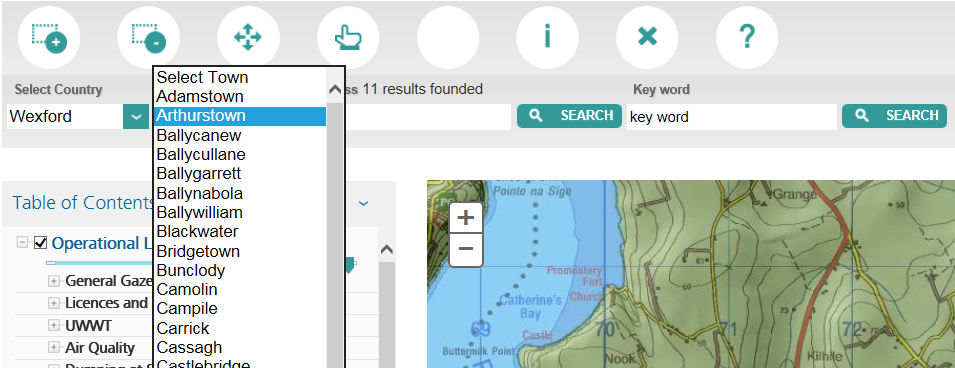
Click on the Search tool on the main toolbar to access the two search tools (County/Town
and Address Search).

To search for a county pick the county from the dropdown list:
the map will automatically update to the extent of that county.
To search for a town
first pick the county that town is in from the dropdown list and then pick the town.
The map will automatically update to the location of the selected town.
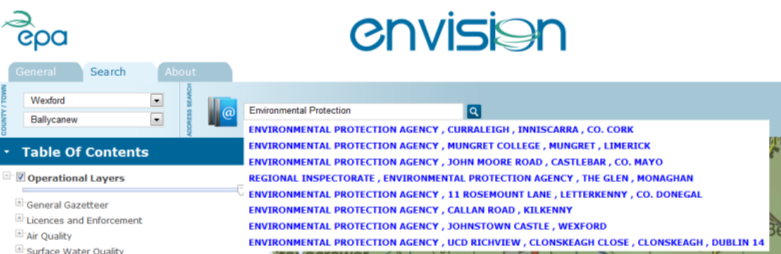
To search for an address, type the address in the Address search field. This is searching addresses available in the GeoDirectory. Suggested
matches will appear in a preview window and you can select one from the list. Click
on the zoom button
 to zoom to the address in the map.
If there is more than one possible match for the address, such as in a house in an estate,
all the potential matches for that address appear automatically in the results window.
Click on the zoom button to zoom to the address in the map.
The Key word searches only the visible layers on the map for keywords typed into the space provided.
The results of the Key word search will appear in the Results pane. The results will be limited to 100 to prevent the application from crashing.
If too many results are returned, please refine the keyword or turn off some of the visiable layers. This tool will not work if there are no
layers visible layers on the map.
Please see the How to Search the EPA GeoPortal help video to search for County, Town, Address and Townland within EPA Maps.
Search for a Townland
To search for a townland you need to first expand the 'General Administrative' folder where the townlands layer is.
You will notice that Townlands is greyed out. This is because there is a layer dependency on that layer meaning that
it can only be made visible when zoomed in further on the map. Keep zooming in on the map until you can toggle the
layer visibility (click the tick box beside the layer name). Once you can do this, go to the Search tool and type in
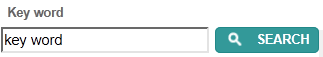
the name of the townland you are looking for in the space provided in the Key word Tool. Click
the Search button
. The Results of the townland search will appear in the results pane. Use the arrow
to see extra the information for a townland or click
on the zoom button
to zoom to that townland.
Please see the How to Search the EPA GeoPortal help video to search for County, Town, Address and Townland within EPA Maps.
Using the Data Download Section
Only EPA data is available for download, Ordnance Survey Ireland data must be sourced
directly from the OSI. To download a layer, click on the Download Data menu.

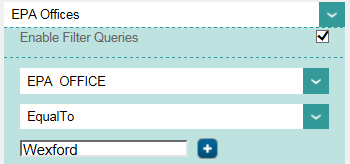
Pick a layer from the dropdown list. The data has been published as a WFS service and you may download it via a specific query by clicking the Enable Filter Queries option and filling in the query boxes (you
may add more than one query criteria by clicking the “+”). Use the dropdown boxes
to set the data field you wish to query and the query operator. Add the query value
to the query text box (e.g. search for specific EPA Office locations).
You can use a Map Bounding Box instead of (or in addition to) the Filter query.
Check this option and then zoom the map to the extent of your area of interest.
When you have selected your data (using the Filter Query, Map Bounding Box or both)
select the format you want to get the data in from the Select format dropdown box.
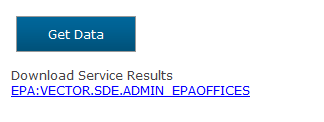
Click the Get Data button. The link to download the data will appear under the Get
Data button.
If the download is empty please refine your query and try again.
Some data (such as WFD Status 2007-2009 and WFD Risk Scores) are not available in this format. The tables showing
this information can still be downloaded in excel or MS Access database format from the Geoportals Data Download page.
Please see the How to Get Data from the EPA GeoPortal help video.
Changing Transparency of map layers
There are 4 sliders in the Table of Contents which control the transparency setting
for data layers in the current browser session.
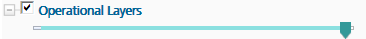
There is a single control for all visible operational layers (all data except the
Ordnance survey Ireland orthphotos). Move the arrow on the slider to the left or
right to make all visible map features appear more or less transparent as you wish:
the map will update automatically. Use the slider for each specific Orthophoto set
to make it appear more or less transparent.

Please note only the Base Map layer will appear by default and you must turn on
the Orthophoto layers to use the transparency feature. It is useful to assess change
in landscape between 1995, 2000 and 2005.
Please see the How to use the EPA GeoPortal Map Transparency Tool help video.
'How to' Help Videos
Learn how to use the tools that can be found within EPA Maps by clicking on each of the following videos:
- How to Get Data from the EPA GeoPortal;
- How to Navigate the EPA GeoPortal;
- How to Search the EPA GeoPortal;
- How to use the EPA GeoPortal Map Transparency Tool.
Using the Help Section
Click on the Help tool of the main toolbar to see
more detailed information about the MAP.
The Help tool opens a window that provides the following information:
- The intended purpose of the MAP;
- Technical details about the Map (what technology was used to develop it and what internet browsers it can be used with);
- A data usage policy for reuse of data displayed on the MAP, including Ordnance Survey Ireland data;
- A list of data sources;
- Credit for specific assistance given in the development of the MAP.
The Contact tool opens the GIS Team Contact Us form. Please enter your specific query and a member of the EPA GIS Team will respond directly.
Back to TopWhere to go with queries
If you have any of the following queries, please use the Contact Us tool on the
main hearder.

- Queries about the MAP (how to use it, where data on the MAP came from)
- Queries about EPA GIS data (data sources, how to access data for your own use)
- To give feedback on the the GeoPortal
- To report a bug or data error
This is the same Contact Us
link is also available on the EPA GeoPortal.
For other querys about EPA web resources on
www.epa.ie please use the query form here
http://www.epa.ie/about/contact/form/.
If you have an environmental query, please use the Environmental Query form at http://www.epa.ie/about/contact/query/.
This will be directed to a member of the EPA Queries unit.
If you have a query about Ordnance Survey Ireland data please go to www.osi.ie